Resource Details
Categories:
Selecting a resource on the Operator canvas opens the Details panel. It shows the resource as Meshery last recorded it from the cluster, and it carries the actions that apply to that kind. Fields with no value are omitted, so each kind shows only what applies.
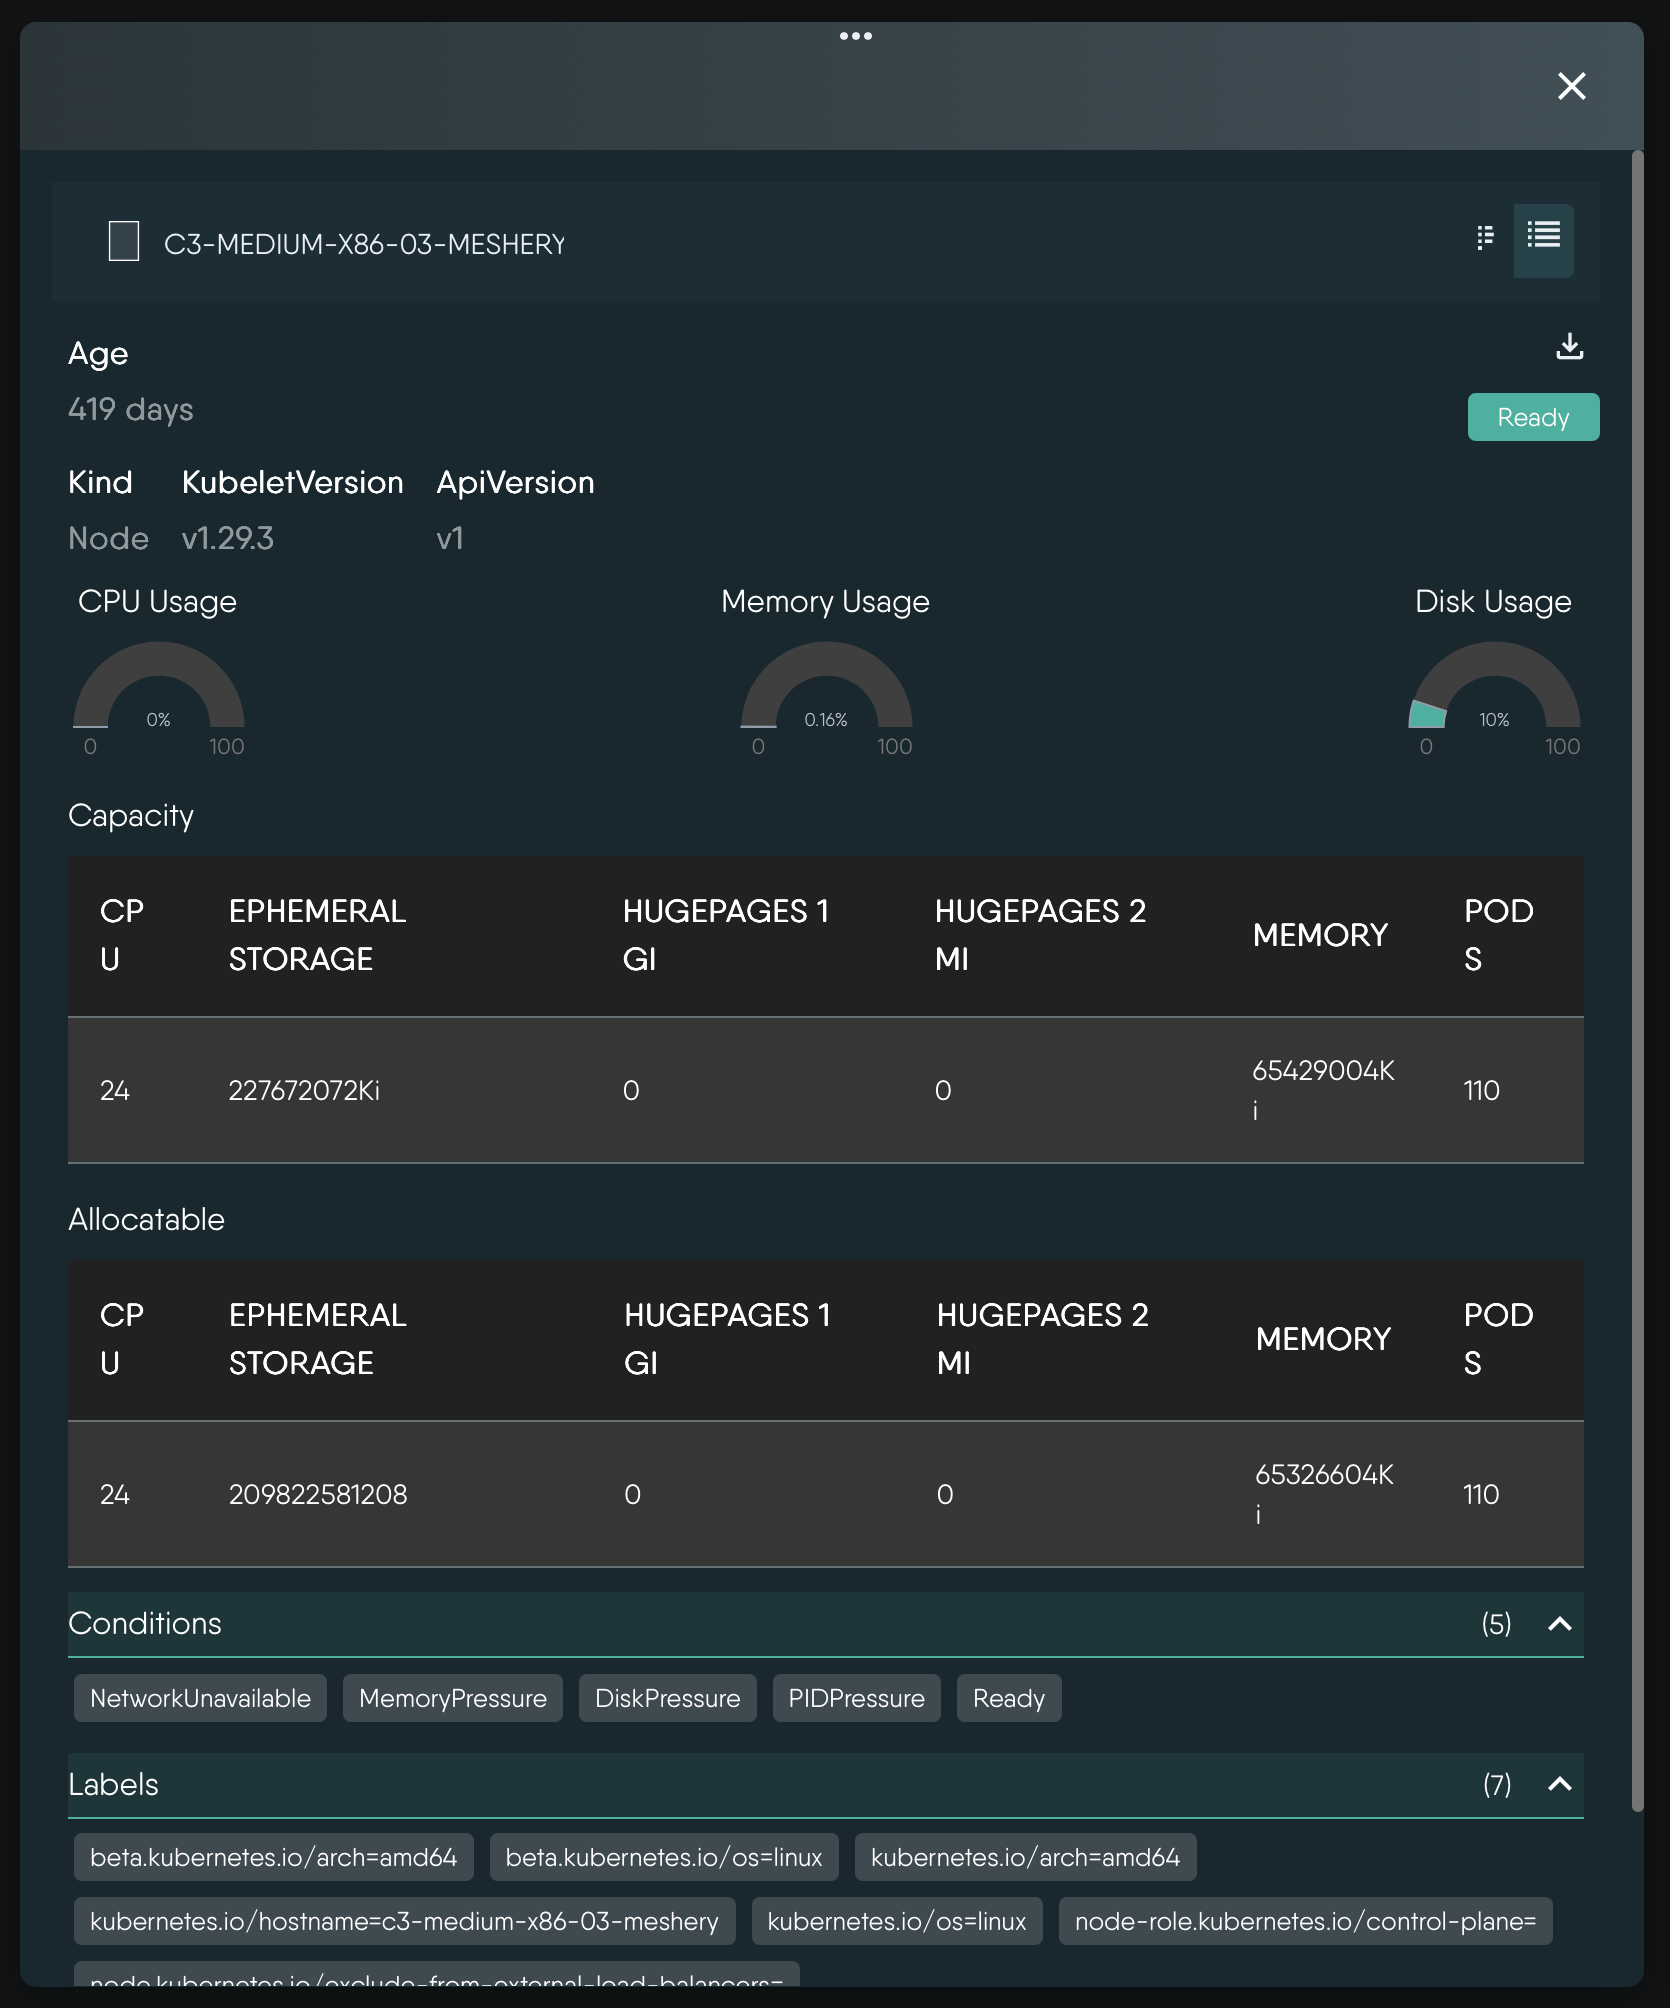
Example: Kubernetes Node details.
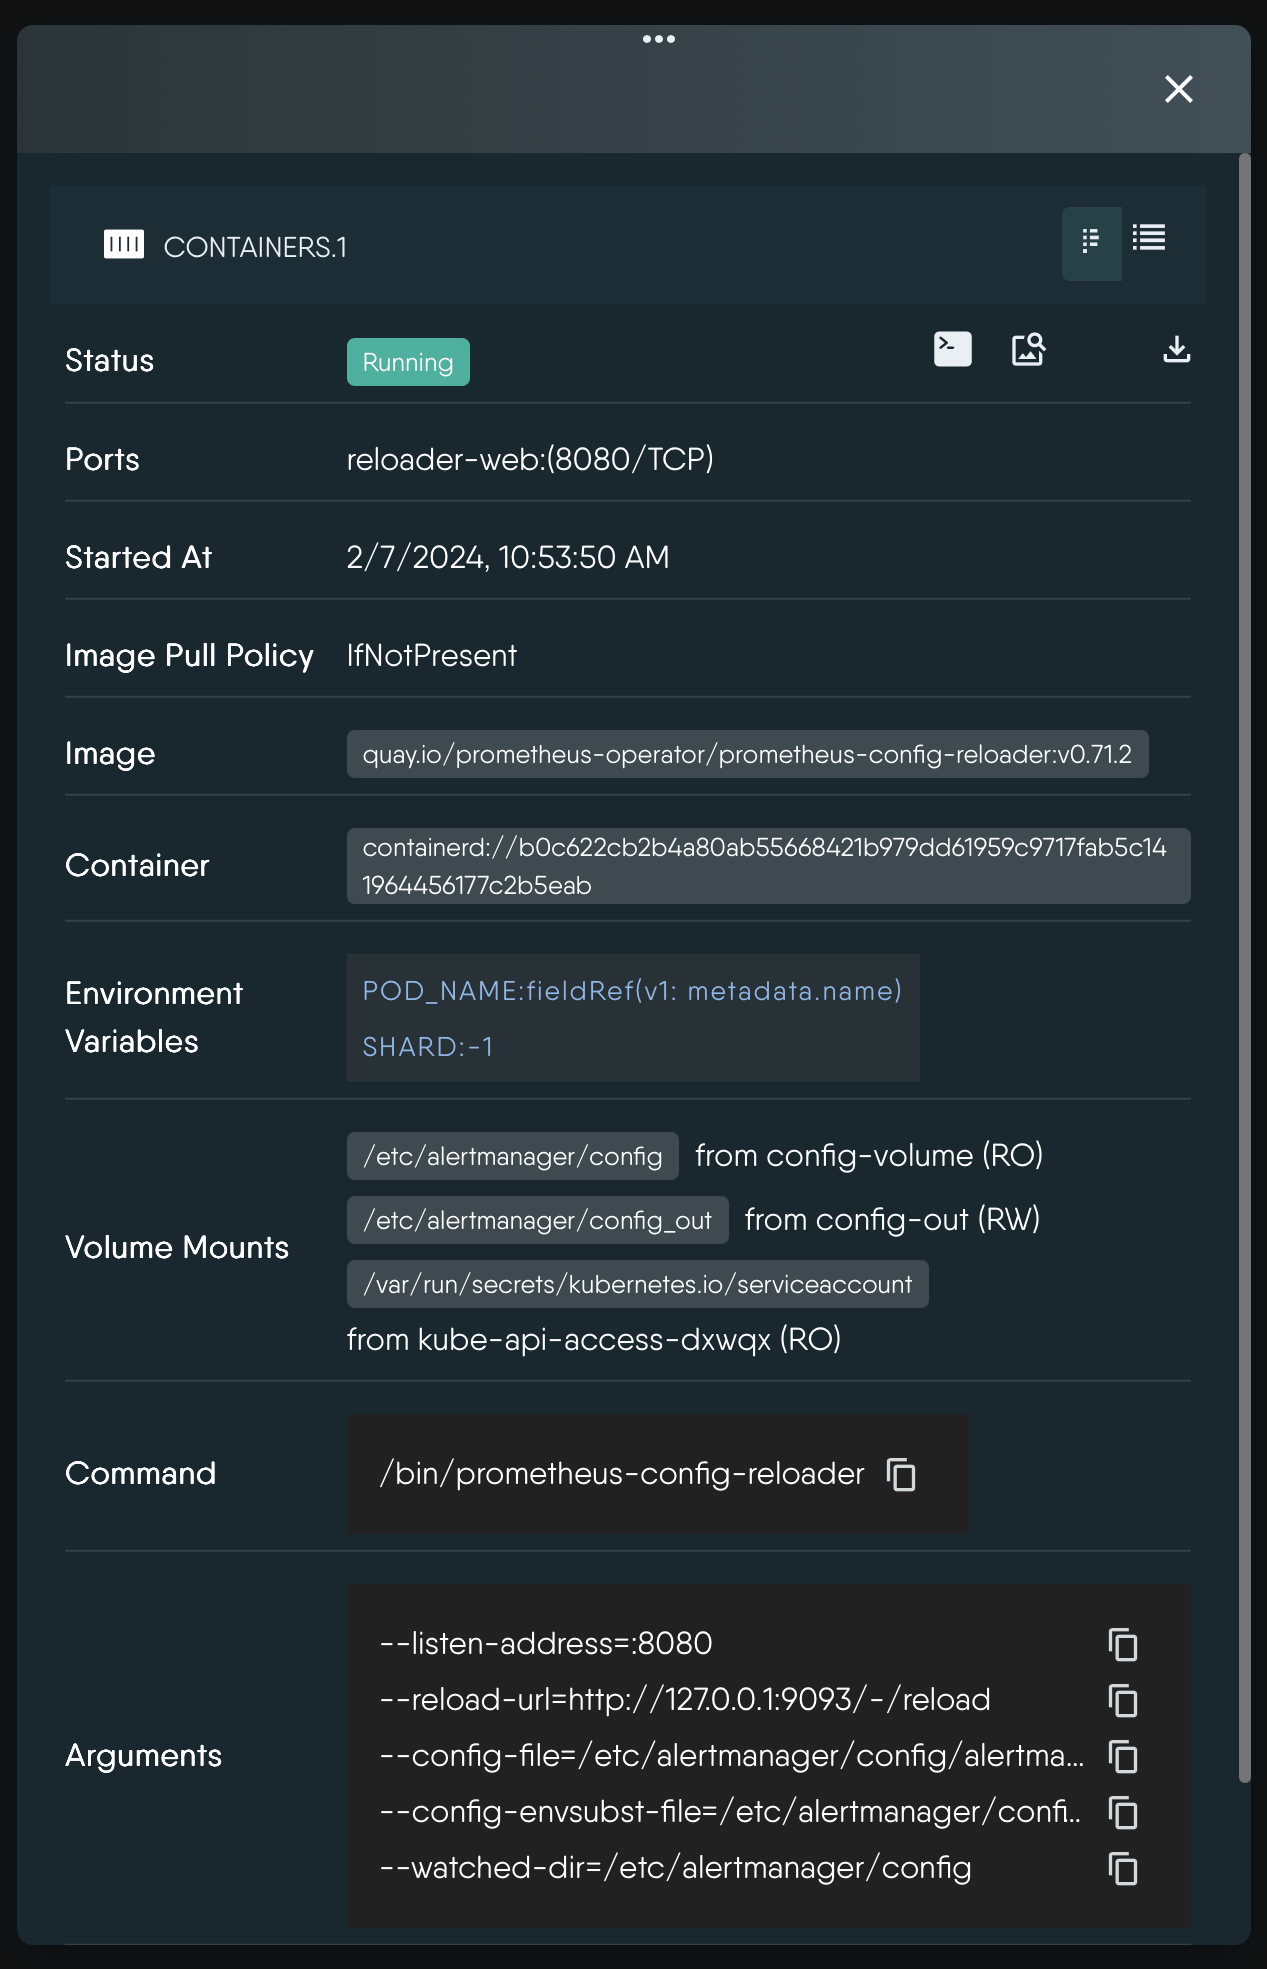
Example: Kubernetes Pod Container details.
How the panel behaves 🔗
- Opens on a single click. Selecting several resources does not change this: the panel always shows the last resource you clicked.
- Not live. The panel shows the canvas snapshot immediately, then fetches the resource’s full record once. It does not update while open. Close and reselect the resource to refresh it. See Operator for how the snapshot is built.
- Two views. Summary (the default) shows the key fields. Details adds the collapsible sections and tables, each titled with its item count, for example
Labels (4). - Status chip. Shows the resource’s phase when it has one (Running, Pending, Failed, Succeeded, Active, Terminating, Bound, Available, and so on). Otherwise it shows
Readywhenever the resource has a Ready condition, whatever that condition’s value. Do not readReadyas a health check. - Load failures. While loading you see a loader. If the fetch fails the panel shows
Error loading instance details.
Fields by kind 🔗
| Kind | Fields shown |
|---|---|
| All kinds | Age (hours below 24 hours, otherwise days), kind, API version, labels, annotations, condition type names (not their True or False values), and deep links |
| Node | Kubelet version, three capacity gauges, and Capacity and Allocatable tables |
| Pod | Pod IP, host IP, QoS class, node selector, priority, container count, total restarts, init containers, containers, volumes by type, tolerations |
| Container | Status, ports, start time, image pull policy, restarts, image, container id, environment variables, volume mounts (read-only or read-write), command, arguments, liveness, readiness, and startup probes, resource requests and limits |
| Deployment, ReplicaSet, StatefulSet | Available and total pods, ready and total replicas, selector, container images from the pod template, update strategy (StatefulSet) |
| DaemonSet | Selector, images, update strategy. Replica counts may be blank. |
| Service | Service type, cluster IP, external IP, selector, load balancer ingress addresses, the remaining spec as an expandable tree |
| Ingress | Rule hosts, the rules as an expandable tree, load balancer addresses |
| PersistentVolume | Capacity, claim, claim namespace, access modes, storage class |
| PersistentVolumeClaim | Requested size, storage class, access modes |
| Namespace | Phase and finalizers |
| Secret, ConfigMap | Secret type. Secret values are not rendered. |
| Event and all other kinds | The fields under All kinds only |
Container environment variables show their plain values. Values drawn from another source appear as source(apiVersion: fieldPath).
Labels and annotations 🔗
Labels render as key=value chips in the Details view. Selecting a chip toggles that label in the open view’s labels filter and the chip turns green. The filter matches resources carrying any selected label, and the view autosaves. Annotations are listed without actions.
Deep links 🔗
A resource that references a Node, Namespace, or ServiceAccount shows a link for each. Selecting one replaces the view’s kinds filter with that kind and sets the name search to the value, keeping other filters. Use it to walk from a failing pod to the node it landed on.
Node capacity gauges 🔗
For a Node, three gauges show how much of the node’s capacity Kubernetes holds back from Pods.
| Gauge title | Resource |
|---|---|
System Reserved Cpu | CPU |
Memory Usage | Memory |
Disk Usage | Ephemeral storage |
Each value is (capacity - allocatable) / capacity as a percentage, rounded to two decimals, using the node’s reported capacity and allocatable. The gauge color follows the value:
| Value | Color |
|---|---|
| 0 to 30 percent | Teal-green |
| Over 30 to 60 percent | Amber |
| Over 60 to 90 percent | Orange |
| Over 90 percent | Red |
Reserved capacity, not utilization
Despite the titlesMemory Usage and Disk Usage, these gauges show reserved capacity, the share of the node unavailable to Pods. They do not show what Pods request or consume. Operator mode shows no live CPU or memory utilization, no per-pod metrics, and no time series. Use your metrics stack for those. Memory and storage parsing assumes the node reports values in Ki units.Actions 🔗
The panel header carries these actions. The same actions are in the canvas right-click menu, except Open Source Design and Download.
| Action | Offered on | Result |
|---|---|---|
Initiate Terminal Session | Pod, Container | Opens shells. See Open an Interactive Terminal. |
Initiate Log Session | Pod, Container | Streams logs. See Stream Container Logs. |
Initiate Performance Test | Service, Ingress | Opens the load test form. See Run a Performance Test. |
Open In Design | Resources deployed from a design | Opens the source design in Designer with this component focused. |
Open Source Design | Resources deployed from a design | Opens the source design. |
Download | All kinds | Saves the resource record as indented JSON. The file name is the resource name with no .json extension. |
A resource counts as deployed from a design when it carries the design identity label that Meshery adds at deploy time. Resources created outside Meshery have no such label and do not offer the design actions. The header also shows Expand and Collapse buttons for every kind; they currently render without an icon.
Events 🔗
Kubernetes Event objects appear on the canvas when you enable Events under Monitoring in the Layers panel. It is a plain kind toggle, grouped with the autoscalers. Selecting an event shows the generic fields only. Because events are short-lived and numerous, filter to a namespace first.
Secrets 🔗
The panel does not render Secret values. The stored values still reach your browser: Meshery keeps the Secret and ConfigMap data MeshSync discovers and returns it with the resource, and Download writes it to the JSON file. Treat downloaded files as sensitive, and restrict who can use Operator mode against clusters whose Secrets matter.
Related 🔗
- Operator Views save the filters you build with labels and deep links.
- Kubernetes events and the Layers panel describes the Layers panel in both modes.
Related Reading
- Open an Interactive Terminal
- Operate Infrastructure
- Operator
- Operator Views
- Run a Performance Test
- Stream Container Logs
Related Videos

Recent Discussions on Kanvas
- Jul 12 | Unleash Visual Power: Import Your Configs by zihan kuang
- Oct 14 | Explore Meshery's Published Relationship Design Examples by Awani Alero
- Oct 03 | Design Review RFC: Kanvas Empty State Enhancement by Lee Calcote
- Jul 19 | [For Discussion] Visual indication of semantically vs non-semantically meaningful Meshery components by Lee Calcote
- Jun 07 | What are the conditions for a "System is unhealthy" warning? by James
- May 30 | Looking for a meshmate to help with first PR by Faisal Imtiyaz123
- Feb 28 | For Discussion: Capturing potential, but unrealized Relationships in Design Snapshots by Lee Calcote
- Feb 12 | Hint on Scaling & Verifying Cronjob in Playground by Sandra Ashipala